 Image 1 of 3
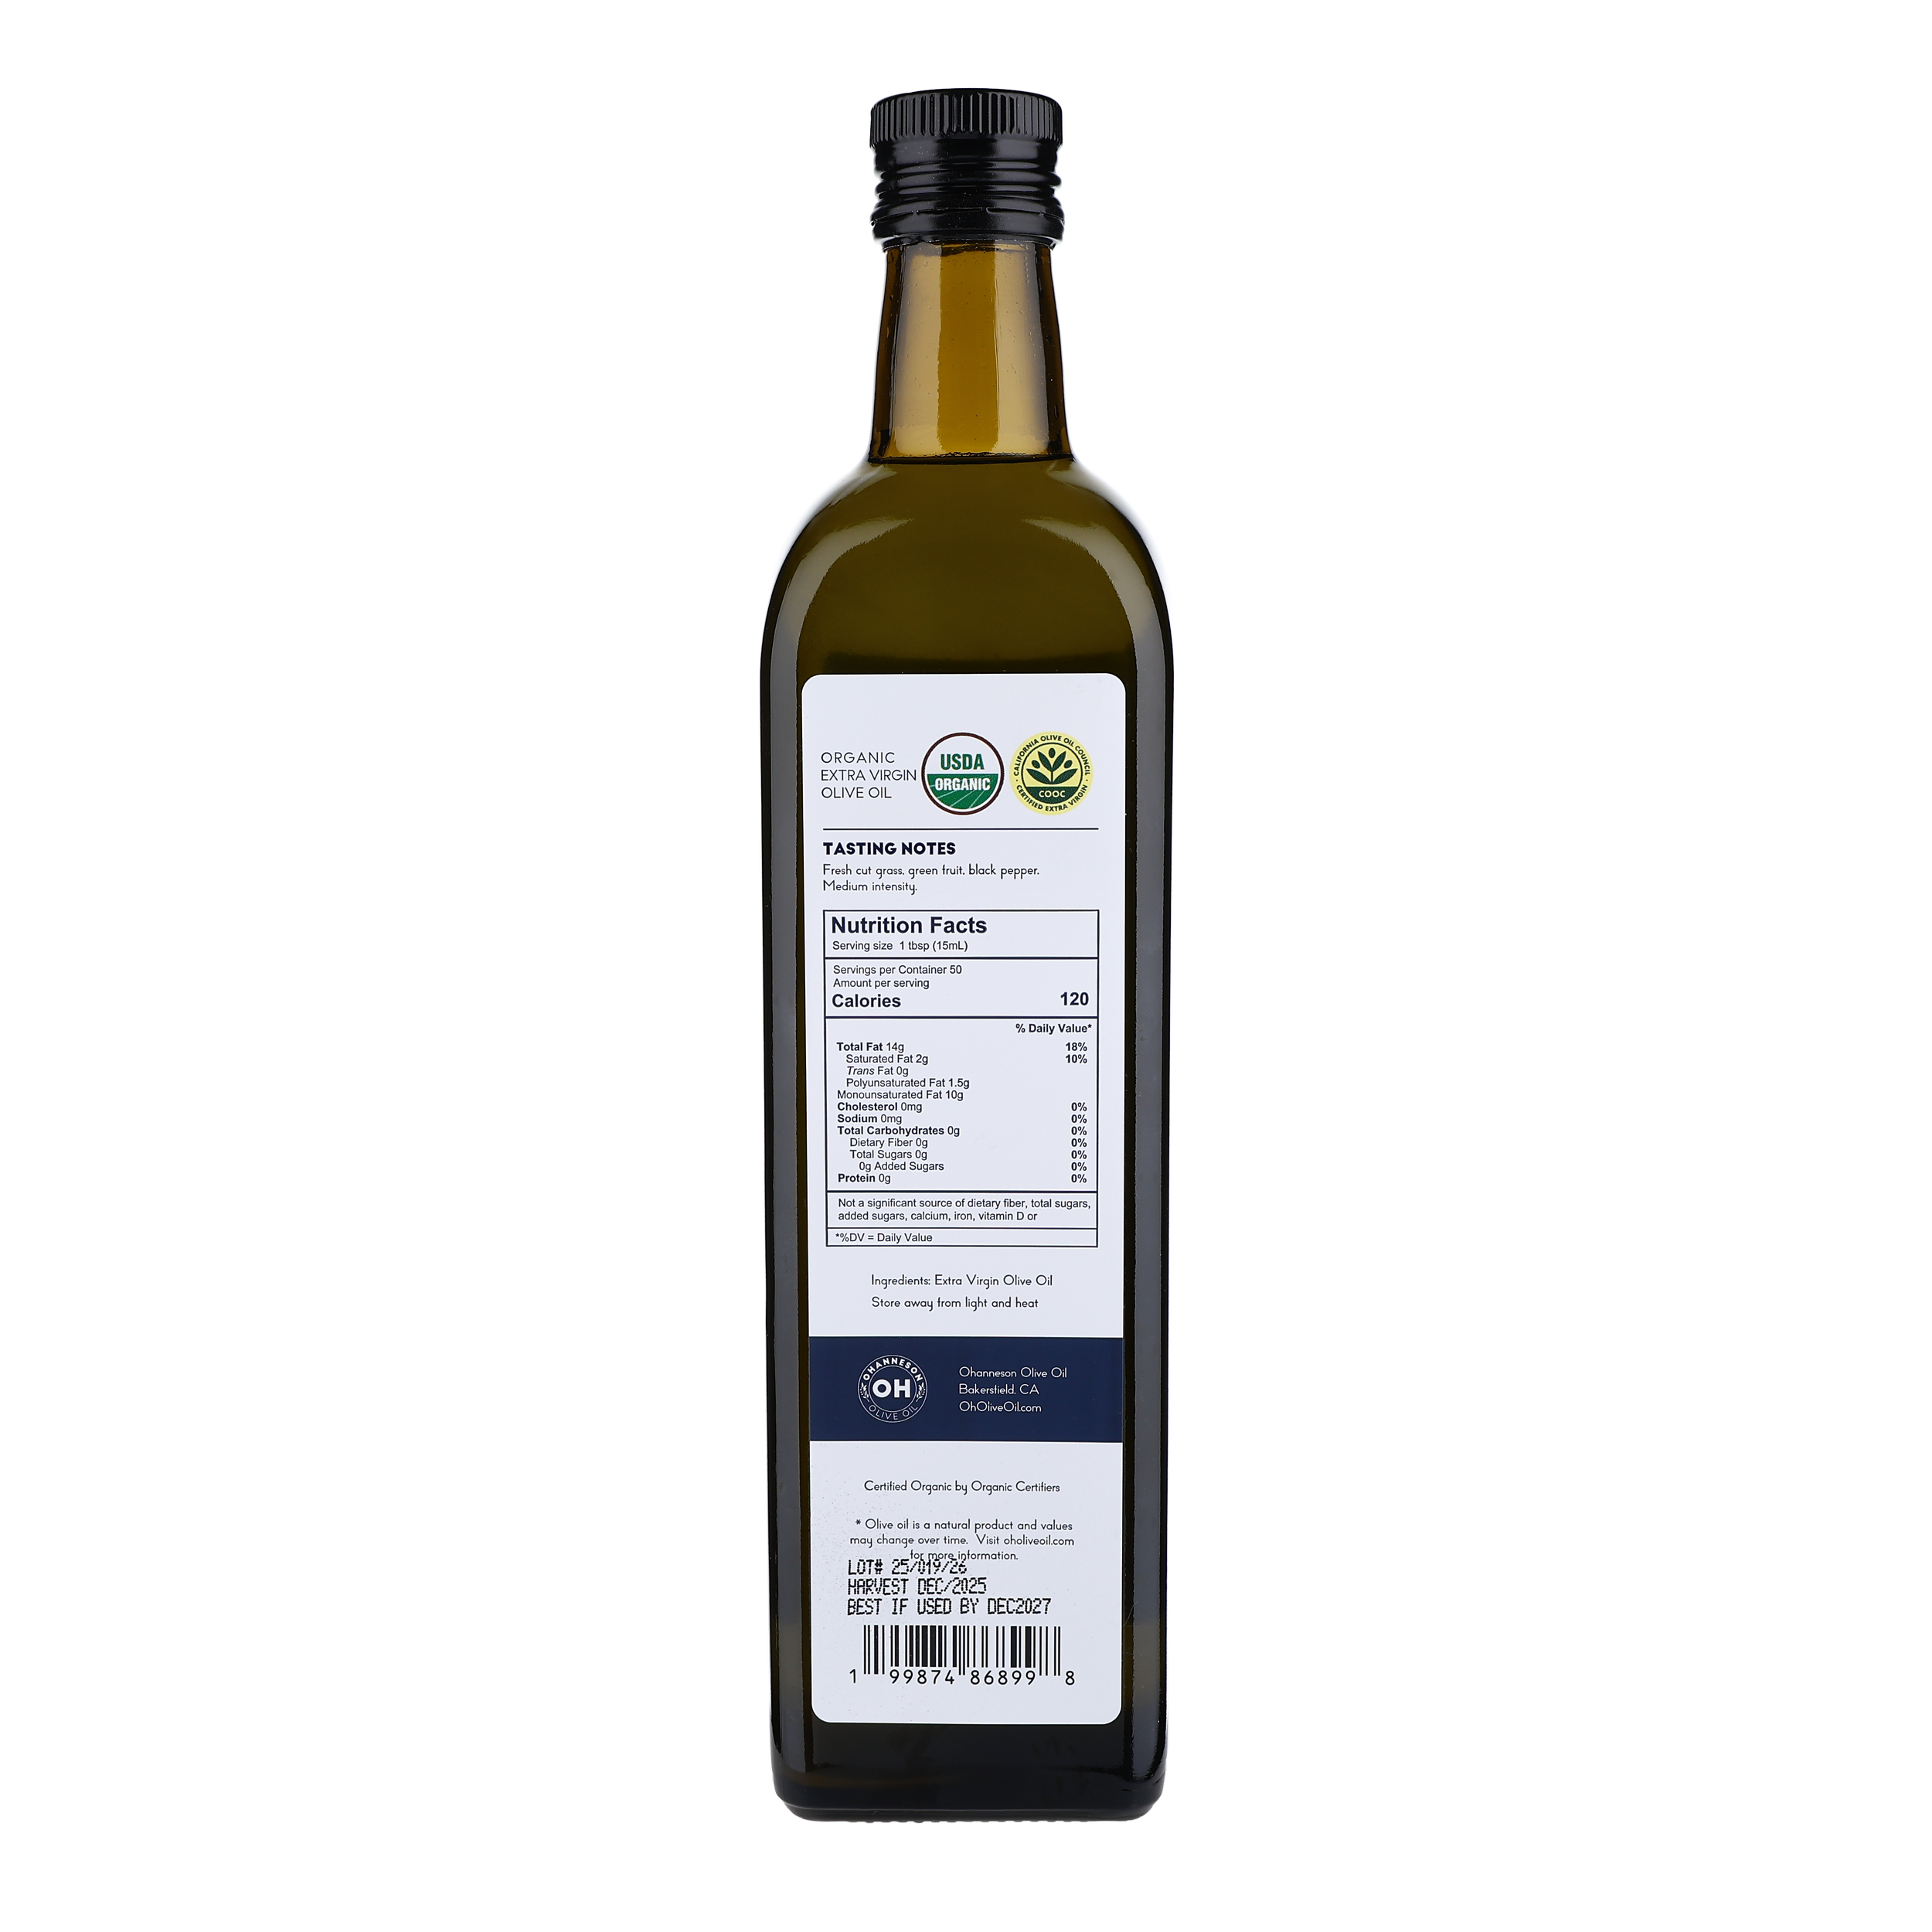 Image 2 of 3
 Image 3 of 3
World Class Chemical Analysis**
| Sample ID | Free Fatty Acids % as oleic acid | Peroxide Value meq/kg | Absorbance at 232nm | Absorbance at 270nm | Delta K 270 | Total Polyphenols mg Tyrosol/kg |
|---|---|---|---|---|---|---|
| 2025 OH Olive Oill | 0.13 | 3 | 1.18 | 0.08 | -0.003 | 333 |
| COOC Standards for Extra Virgin Olive Oil | <= 0.50 | <= 15 | <= 2.40 | <= 0.22 | <= +0.010 | |
| USDA Standards for Extra Virgin Olive Oil | < 0.80 | < 20 | <= 2.50 | <= 0.22 | <= +0.010 |
This year’s acidity result of 0.13 is our best yet and shows how impressive our harvest and milling processes are, resulting in one of the best extra virgin olive oils in not just California, but the world.
** These values are from accredited lab analysis in November, 2025. Olive oil is a natural product and values may change over time. Numbers are provided for informational purposes only.
For more information on our chemical analysis, check out our About page.
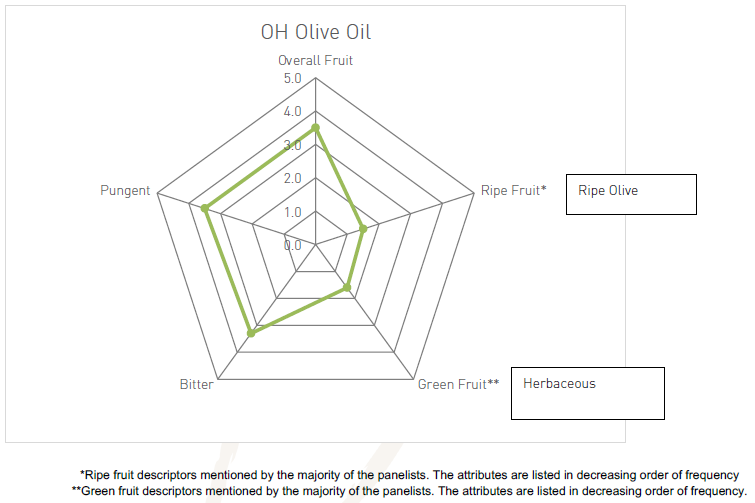
Spiderweb chart created by Applied Sensory, LLC on 11/21/2025, showing the flavor profile of the 2025 vintage of OH Olive Oil. Note that Ripe fruit and green fruit descriptors mentioned by the majority of the panelists. The attributes are listed in decreasing order of frequency.
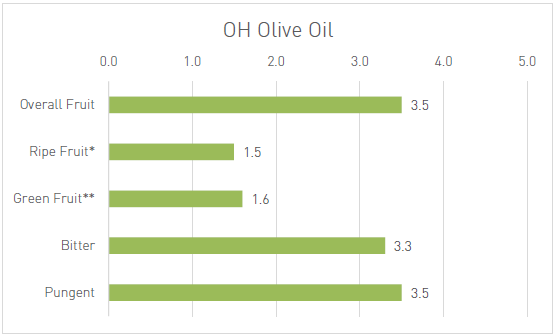
Spiderweb chart created by Applied Sensory, LLC on 11/21/2025, showing the flavor profile of the 2025 vintage of OH Olive Oil. Note that Ripe fruit and green fruit descriptors mentioned by the majority of the panelists.